

AI attendance insights take the check-in data your studio already collects and turn it into predictions about who's likely to drop off, which classes are about to fill up, and where your schedule is wasting instructor hours. The immediate payoff is time: automation of this kind typically saves administrators 8 to 10 hours a week, hours that used to go into spreadsheets and manual follow-up calls. Some platforms build this directly into daily operations instead of bolting it on as a separate report.
TL;DR:
- Automated attendance insights can save studios 8 to 10 hours weekly by analyzing check-in data, class demand, and student behavior for proactive management.
- Key metrics include attendance rate, churn risk, fill rate, and waitlist conversion, which directly impact revenue and retention goals.
- AI-driven predictions utilize multiple data sources to flag at-risk students and demand issues, enabling targeted outreach and operational adjustments.
- Implementing these tools requires clean data, proper system integrations, and a staged 90-day pilot to validate prediction accuracy and staff trust.
- Studio platforms like Studioflare integrate all relevant data, reducing the need for separate analytics tools and supporting automated, actionable insights.
Table of Contents
- What AI Attendance Insights Actually Are and How They Work
- Core Attendance Metrics Every Studio Should Track
- How AI Turns Attendance Patterns Into Predictive Signals
- The Action Playbook: Six Moves You Can Make This Week
- Implementation Checklist: Data, Integrations, and Privacy
- How Studioflare Applies These Principles
- Editor Perspective: Balancing Pedagogy and Automation
- Try It Yourself: A 30-Day Pilot With Studioflare
- Sources
- FAQ
What AI Attendance Insights Actually Are and How They Work
AI attendance insights are not a fancier attendance sheet. They're a layer of analysis sitting on top of data your studio generates every day, converting raw check-ins into forecasts a front-desk manager can act on before a problem shows up on the revenue report.
The system pulls from several sources at once:
- Class registrations and enrollment history
- Check-in timestamps from the front desk or a mobile app
- Payment status and billing cycles
- Waitlist entries and cancellation patterns
- Livestream view logs, for studios running hybrid classes and online education
Once that data is flowing, the outputs are what make the difference. A well-built system calculates attendance rate trends per class, assigns a churn-risk score to individual students, and forecasts demand for specific time slots weeks out. That information doesn't sit in a report nobody opens. It shows up on a dashboard, gets pushed as a scheduled weekly summary, or triggers an alert the moment a student crosses a risk threshold. Some platforms route it through automation hooks that fire an email or text without a staff member lifting a finger. Industry coverage increasingly treats this as predictive business intelligence rather than passive record-keeping, and that shift in framing matters. A spreadsheet tells you what happened last month. A prediction tells you what to do this week.
Core Attendance Metrics Every Studio Should Track
Not every number on a studio report deserves your attention. These seven do, because each one ties directly to revenue or retention rather than just activity.
- Attendance rate. The percentage of registered students who actually show up per class, tracked weekly rather than monthly so you catch a slide early.
- Rolling retention. The share of students still enrolled 30, 60, and 90 days after their first class. This is the number that predicts your revenue six months out.
- Churn risk. A composite score combining declining attendance, late payments, and missed make-ups. Treat any student flagged here as a priority, not a statistic.
- No-show rate. Registered but absent, with no cancellation. High no-show rates distort your real demand picture and waste instructor time.
- Fill rate. Enrolled students divided by class capacity. A class running at 40% fill rate for a month is a scheduling problem, not a marketing one.
- Waitlist conversion. How often a waitlisted student actually gets a spot and shows up. Low conversion means your waitlist policy needs work.
- Average class size. Useful mainly as a trend line. A steady drop across a quarter is an early warning sign long before it hits your bank account.
Attendance rate, instructor utilization, and revenue per class are the three most commonly tracked figures across studio analytics platforms, and for good reason: together they explain most of the variance in monthly revenue.
How AI Turns Attendance Patterns Into Predictive Signals
Raw attendance data tells you what already happened. AI's real value is in what it flags before the next thing happens.
Dropout-risk scoring works by feeding attendance history, payment status, and booking notes into a model that assigns each student a risk level. A student who misses two classes in a row, hasn't updated a payment method, and skipped a make-up offer is a very different case than one who missed a single class for a scheduling conflict. Combining attendance with booking questions and payment history sharpens the accuracy of that score considerably compared to attendance data alone. Once a student crosses a risk threshold, the workflow can auto-generate a personalized check-in message and flag the instructor to mention it in class.
Auto-fill and waitlist automation use the same predictive logic in reverse. If the system knows a class typically sees two no-shows, it can offer those spots to waitlisted students automatically instead of leaving them empty.
Demand forecasting looks across weeks of data to spot which time slots are chronically underused, so you can consolidate two half-full classes into one strong one rather than running both at a loss.
- Signal: three straight weeks of sub-60% fill rate on Tuesday 4pm ballet
- Action: merge with the 5pm class or move it to a higher-demand slot
Pro Tip: Start dropout-risk alerts with a single program, like your competitive team or one age group, before rolling them out studio-wide. You'll catch false positives fast and build staff trust in the system.
The Action Playbook: Six Moves You Can Make This Week
Insights only matter if someone acts on them. Here's the sequence that turns a flagged data point into a retained student or a fuller class.
- Targeted retention outreach. When a student crosses the churn-risk threshold, send a personalized message within 48 hours, not a generic newsletter. Reference their specific class and offer a make-up slot.
- Test a schedule change safely. Before permanently moving a class, run it at the new time for four weeks and compare fill rate against the old slot before committing.
- Automate waitlist promotions. Set the system to offer open spots to waitlisted students the moment a cancellation posts, with a short response window before it moves to the next name.
- Give instructors a heads-up. Custom booking questions feeding into pre-class notes make a real difference. Studios using them report 62% of instructors feel more prepared walking into a session.
- Run cohort campaigns for weak segments. If an entire age group's attendance is dipping, address it as a group with a targeted email or promotion rather than one-off messages.
- Set threshold rules for sections. Waitlist over five names with a fill rate under 80% should automatically trigger a review of whether to add a section.
Implementation Checklist: Data, Integrations, and Privacy
Rolling this out doesn't require an IT department, but skipping the groundwork guarantees bad predictions.
Start with data quality. Your roster needs clean, deduplicated records, and check-ins need accurate timestamps, not end-of-day batch entries a staff member typed in from memory. On the integration side, prioritize connecting registration and payment data first, then check-in logs, messaging, and livestream view logs if you run hybrid classes.
- Confirm roster hygiene: no duplicate profiles, current contact info
- Connect payment and registration systems before attendance analytics
- Add livestream and messaging data once the core pipeline is stable
- Write a plain-language privacy notice explaining what attendance data is used for and where consent records live
On timeline, a 30/60/90 day pilot works well: weeks one through four for data hygiene and baseline reporting, weeks five through eight for automated alerts, and weeks nine through twelve for tuning thresholds before scaling studio-wide.
Pro Tip: Measure your baseline retention rate before turning on any automation. Without it, you'll have no way to prove the insights actually moved the number.
How Studioflare Applies These Principles
Some platforms are built around this exact checklist rather than treating attendance analytics as an add-on. Core features often map directly to what a studio needs for this to work:
- Attendance and check-in tools that feed clean, timestamped data automatically
- AI-powered features that analyze class fill rates and payment status on demand
- Automated tuition billing integration to support accurate payment tracking
- Livestream tools that capture hybrid-class attendance data
Because registrations, billing, check-ins, and communication live in one system, the attendance data your studio generates stays connected instead of scattered across three tools that don't talk to each other. That's what makes the predictive layer possible in the first place.
Editor Perspective: Balancing Pedagogy and Automation
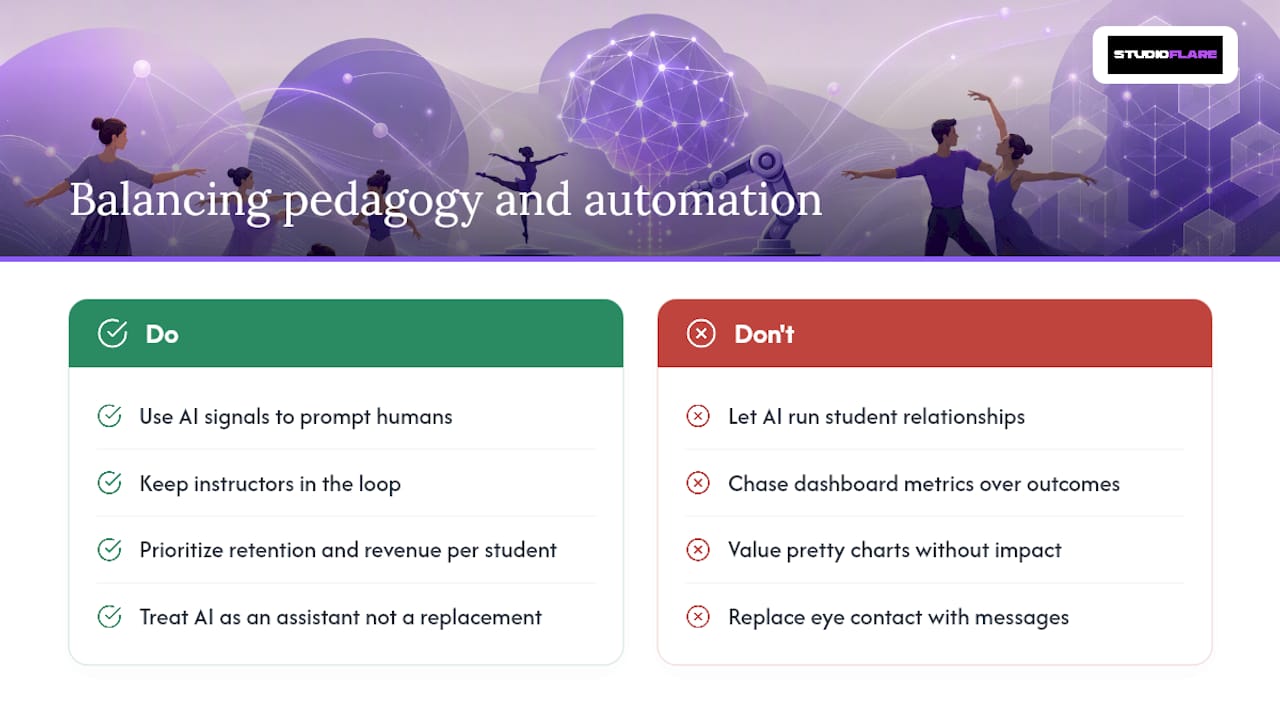
The temptation with any AI tool is to let it run the relationship with your students. Resist that. Use these signals to prompt a human conversation, not to replace one. An instructor's five seconds of eye contact with a struggling student still does more than any automated message ever will.
The mistake we see studios make is chasing dashboard metrics instead of retention and revenue per student. A pretty chart that doesn't change a single outcome isn't worth the screen space.
— StudioFlare Team
Try It Yourself: A 30-Day Pilot With Studioflare
If you're running a studio on spreadsheets, group texts, and a payment processor that doesn't talk to your roster, the fastest way to see what attendance insights actually feel like is to pilot them on one program for 30 days. This platform replaces that patchwork with one system where check-ins, billing, and messaging sit together, so the risk scores and fill-rate alerts described above aren't a future feature. They're available the day attendance tracking is enabled.
Start with your highest-enrollment class. Watch the attendance dashboard for two weeks to establish a baseline, then let the AI assistant flag your first churn-risk students and test a personalized outreach message. If you're currently on a legacy system, the Mindbody alternative built for dance studios walks through what switching actually involves. When you're ready to see the attendance tools in action, create your studio account and set up your first pilot program this week.
Sources
The time-savings figures and predictive-analytics framing in this article draw on reporting from Dance Studio Journal's coverage of AI scheduling automation and its analysis of AI-powered studio software, along with American Dancer's reporting on AI in studio management. For implementation details, Studioflare's guide to managing attendance without a clipboard covers the day-to-day transition from manual tracking.
- AI scheduling automation transform dance studios in 2026
FAQ
How Much Time Can AI Attendance Tools Actually Save?
Studios typically report 8 to 10 hours saved per week on administrative attendance work, translating to an estimated $15,000 to $25,000 in annual labor cost at typical staff pay rates.
What Data Do I Need Before Starting?
You need clean registration records, accurate check-in timestamps, and connected payment status at minimum. Livestream logs and waitlist data add accuracy but aren't required to start.
Do I Need a Separate Analytics Tool?
Not if your studio management platform already surfaces attendance analytics inside your existing workflow. Integrated systems like Studioflare avoid the need for a standalone business intelligence tool by keeping rosters, billing, and attendance data in one place.
How Do I Know If a Churn-Risk Score Is Accurate?
Combine attendance trends with payment history and booking notes rather than relying on attendance alone, since that combination consistently improves prediction accuracy over single-metric scoring.
What's a Reasonable Timeline to See Results?
Plan for a 90-day pilot: four weeks establishing baseline data, four weeks running automated alerts, and four weeks tuning thresholds before expanding to additional programs.